If you’re dealing with aviation systems measuring key power quality parameters at 400Hz is a must. The Fluke 437-II provides that capability (and measures at 50 and 60Hz too) and is designed for users who need to quickly get to the source of the power quality problem, so they can minimize expensive downtime. The integrated shipboard power measurement system analyzes according to MIL-STD 1399 to automatically give a full evaluation of voltage, current and power according to the standard. This evaluation makes measurement and analysis as easy as can be. The measurement process, and the way the 437-II displays data has been optimized to provide to the most important information as quickly as possible. Multiple parameters are measured simultaneously and are displayed in formats that quickly describe overall power quality health while giving you the detailed information you need to make better maintenance decisions. Data can be quickly accessed as simple digital values, viewed as trend graphs that give you fast insight into changes over time, or viewed as waveforms and phasor diagrams or analyzed. Data can also be organized into tabular format for viewing events where the magnitude, duration and time stamp enable rapid correlation to the problems you are experiencing.
Locating, Predicting, Preventing and Troubleshooting Power Quality Issues—Up to 400Hz
Higher power frequencies mean smaller and lighter transformers and motors – a critical factor in avionic and military transport applications where weight is a primary concern. The Fluke 437 Series II Power Quality and Energy Analyzer can show you the cost of energy waste due to poor power quality and is ideal for characterizing power quality, conducting load studies and capturing hard-to-find voltage events over a user-defined period of time. Designed for capturing power quality measurements in avionic and military systems, Fluke 437 Series II is the must-have 400 Hz quality analyzer.
Advanced Power Quality Health—At-a-glance power quality health data in real-time so you have the data you need, when you need it

Power wave data capture
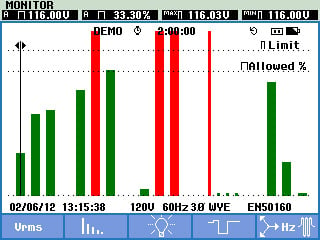
The Fluke 437-II Power Quality Monitor and Energy Analyzer utilizes an integrated Power Quality Health summary that gives you an at-a-glance view of a complete range of power quality issues in real time. With a simple graphical presentation, complete with tolerance limits, you can quickly discover which power quality problems may be present on your electrical system. If you don’t know where to start or what problems might exist, the advanced Power Quality Health summary will simplify the task and serves as a comprehensive starting point for further troubleshooting.
PowerWave Data Capture—Quickly identify how motor and generator startups are impacting electrical system performance
With PowerWave data capture you can capture three-phase high resolution voltage and current waveforms for up to five minutes along with detailed RMS voltage and current values. By analyzing the interaction of these values over time you can correlate the effects of voltage, current and frequency during the critical startup of motors and generators. PowerWave even goes beyond the standard power quality measurements allowing you to record half cycle rms values on 8 channels, frequency and instantaneous power (Vrms1/2, Arms1/2, W, Hz and scope waveforms for voltage, amps and watts)
Power Inverter Efficiency
Power inverters take DC current and transform it into AC current, or vice versa. But, what percentage of that power going into the inverter comes out as usable current? The Fluke 437-II Power Monitor and Energy Analyzer has an integrated power inverter efficiency mode that allows users to better understand power inverter performance. Nothing is ever 100% efficient, and a power inverter’s efficiency will vary depending on how much power is being used at the time (with the efficiency generally being greater when more power is being used). Inverters can also lose performance over time and need to be checked. By comparing the input power with the output power, you can determine the system efficiency. With the Power Inverter Efficiency feature you can discover just how good your inverter is at converting your DC power to AC (or visa versa). Poor power efficiency may occur when the inverter is wrongly sized for the load.
AutoTrend—Quickly see the trend

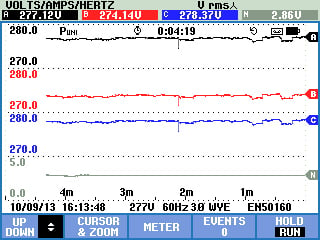
AutoTrend capability shows changes over time
With a unique AutoTrend feature you can get fast insight into changes over time. Every displayed reading is automatically and continuously recorded without having to set up threshold levels or having to manually start the process so you can quickly view trends in voltage, current, frequency, power, harmonics or flicker on all three phases plus neutral.
 Malaysia